


PEAK LIMITATION: EFFECTIVENESS & IMPACT (Ex : Tutu - Warner Bros.)
If Peak Limitation allows us to raise the average level compared to the maximum encodable level (0 dBFS), it practically doesn't improve the sound, which should be the goal.
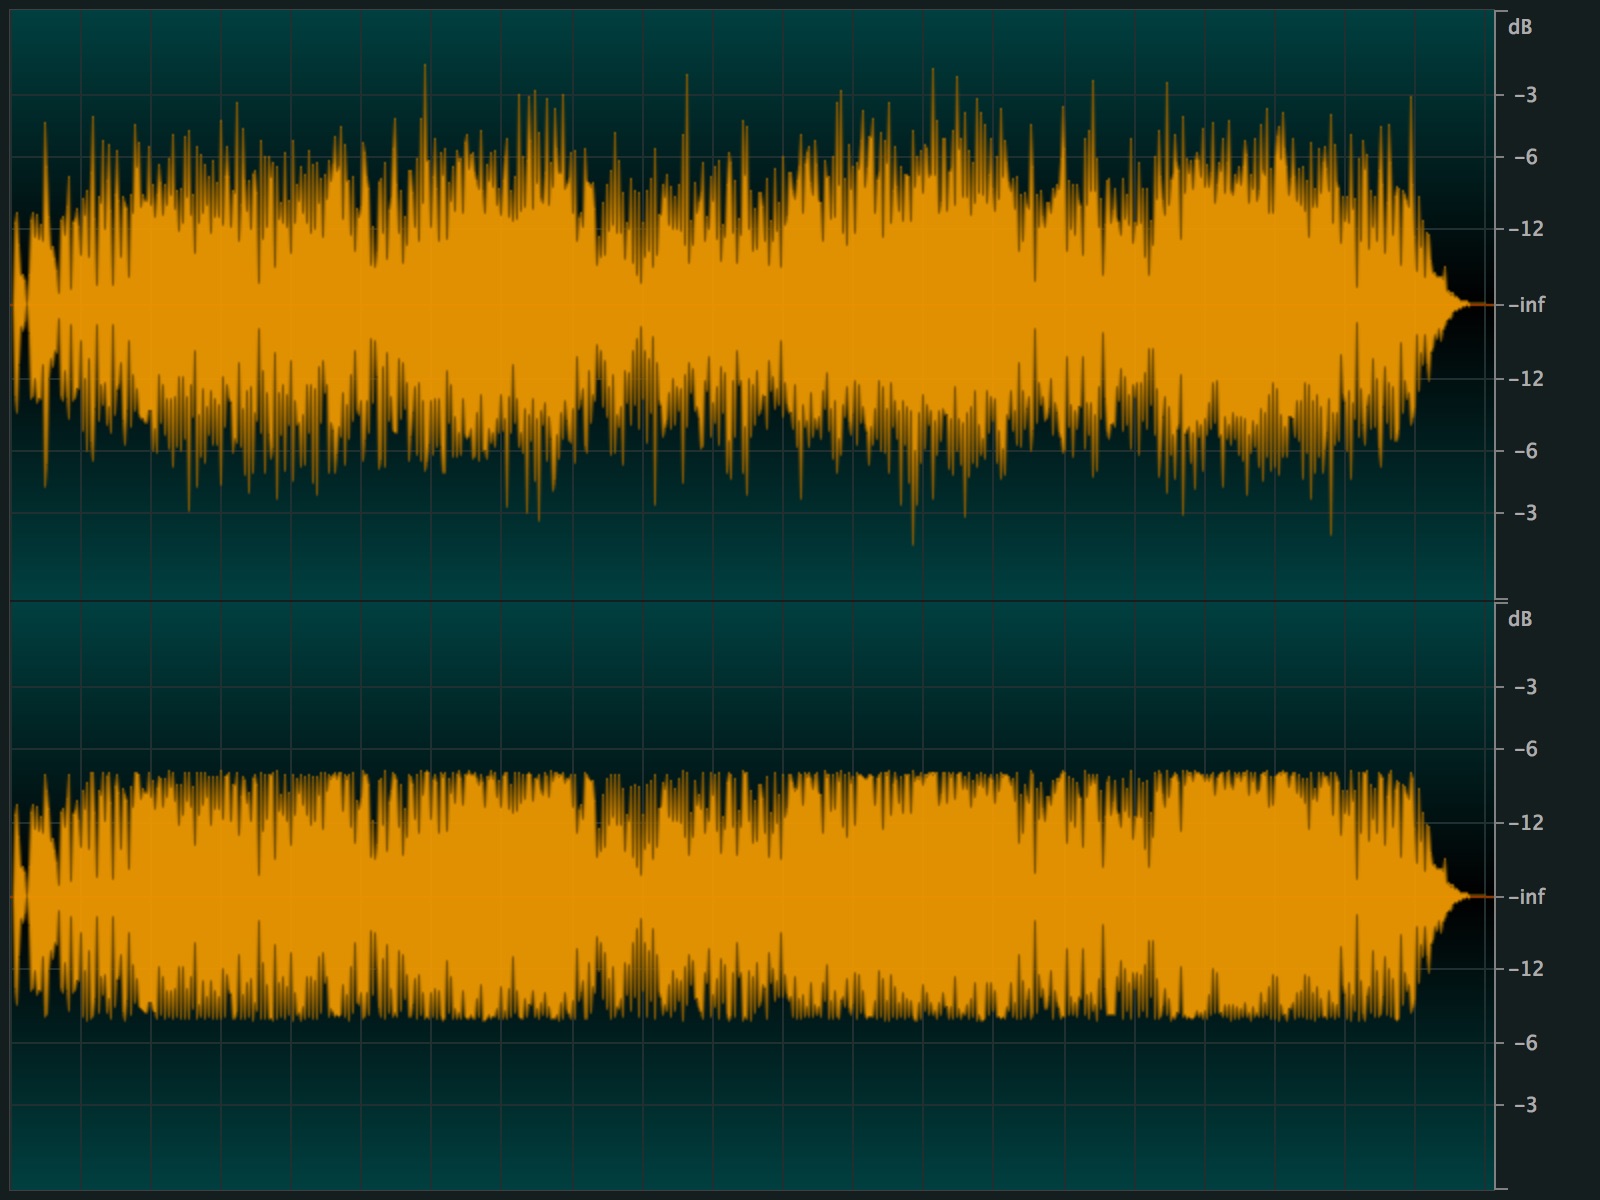
Top: Tutu 1986 audio signal / Bottom: Tutu 2015 audio signal with identical RMS
To better understanding of the hidden effect of this processing, it is possible - though a few manipulations of the signal - to visualize, quantify and listen to the DIFFERENCE, i.e. the parts of the signal that have been "removed" (or limited), by subtraction between the Source signal and the Limited signal.
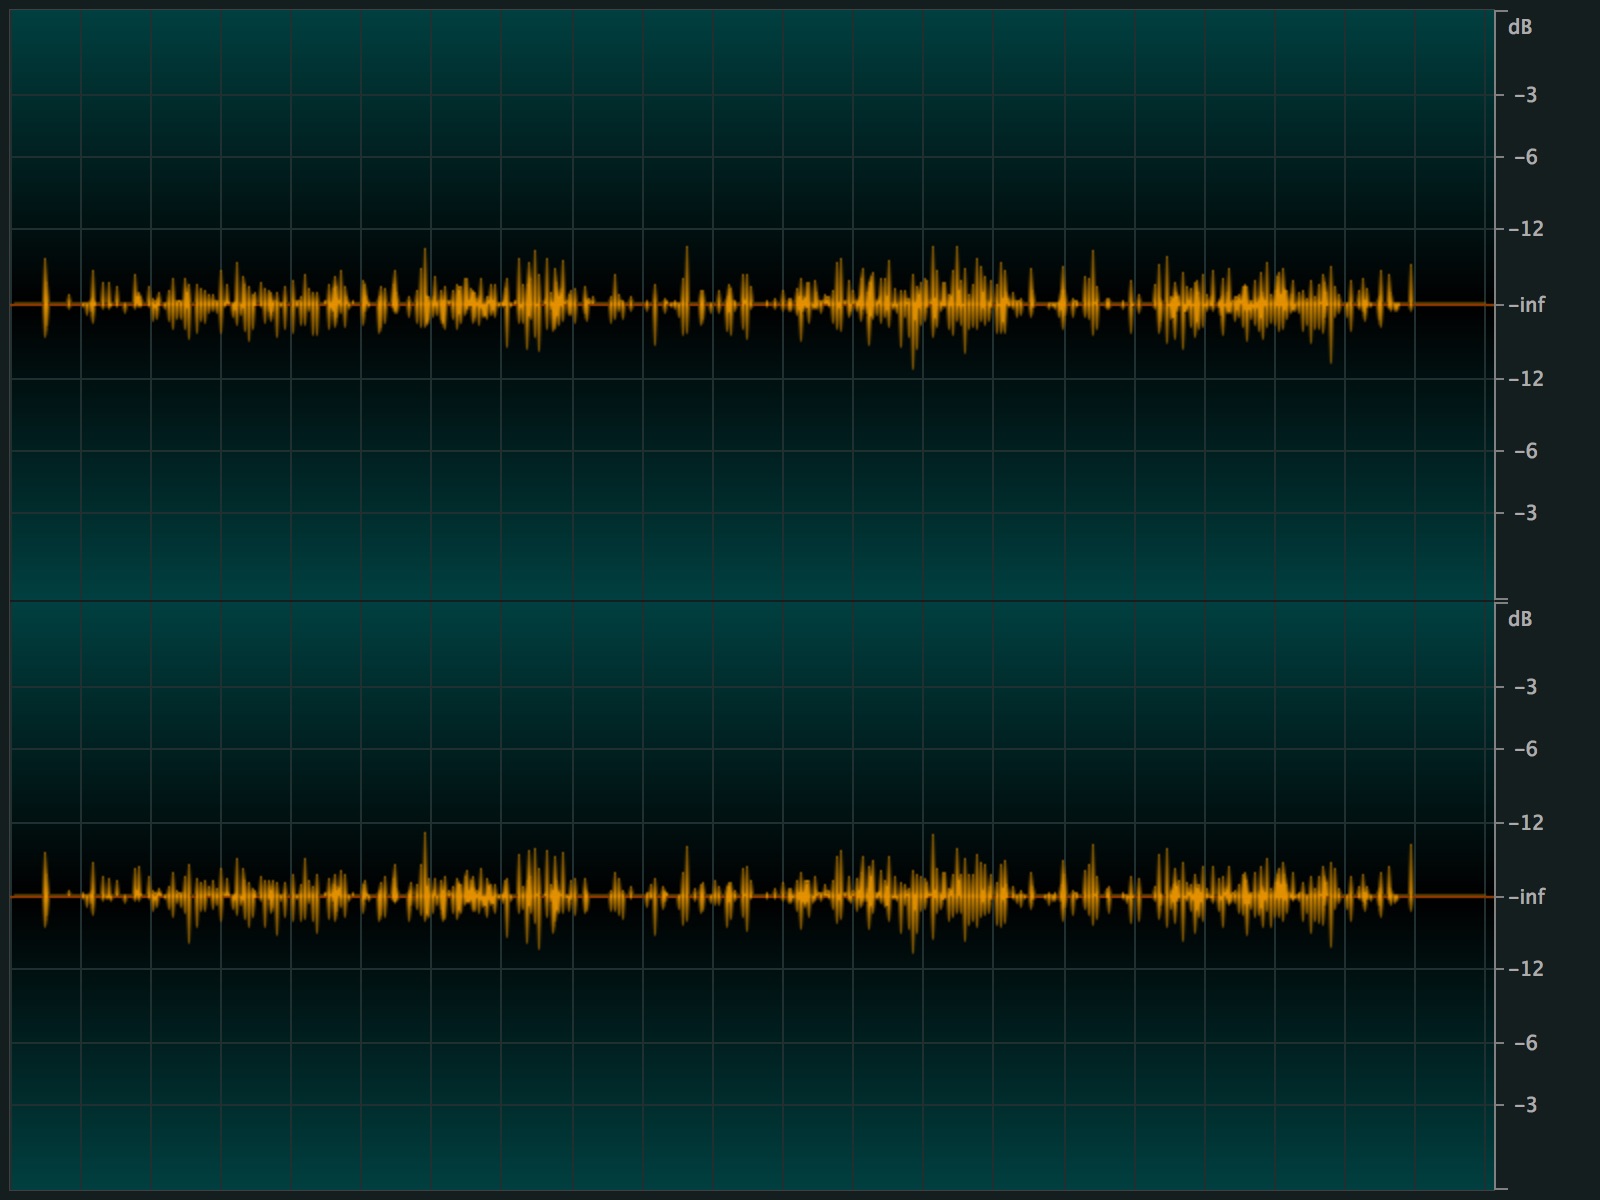
Signal Difference (L/R) between 1986 Master and Remastering Warner Bros. 2015 (simulation)
The peaks cut (7 dB in our example) — as a side effect — generates a Harmonic distortion, which makes the signal more "aggressive" (H3 - yellow line) or more melodic (H2 - red line).
As example in the graph below, the limiter used for this test generates a lot of H3 harmonics below 1000 Hz, and very little above 2000 Hz.
Note that the quality of the limiter used and its rate of odd harmonic coloration depends on the Mastering service provider.
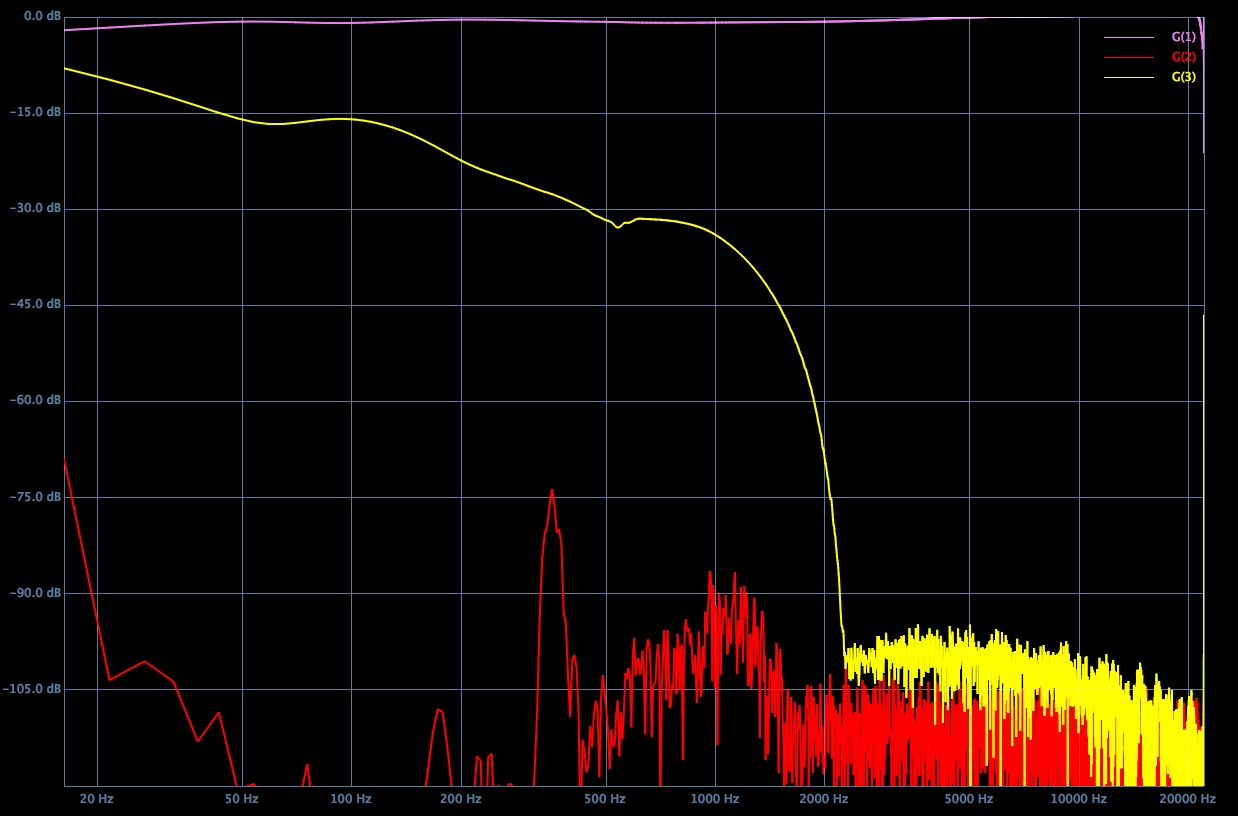
E.g.: Values of 2nd and 3rd Harmonics (H2, H3) - depending on the frequency - for a 7 dB limitation